UC Berkeley’s Social Science Matrix, a new center dedicated to advancing cross-disciplinary research, is leading the development of an interactive tool for identifying and visualizing different kinds of collaboration taking place among social scientists at UC Berkeley. When completed, the Berkeley Network Graph will help illuminate which researchers and institutions are working together in which topical areas.
“We’ve reached out across the Berkeley campus to get a lot of data sets that are open but might not otherwise be easily accessible,” says Elaine Sedenberg, a Ph.D. student from Berkeley’s School of Information, who is leading the data gathering and analysis effort to develop the Network Graph. “We’re interested in, what does the research landscape look like? What are the topics people are working on, how do people collaborate, and how has that changed over time?”
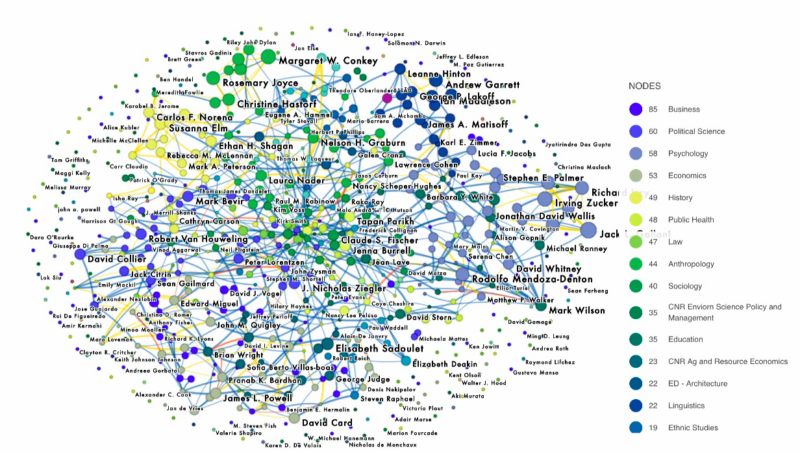
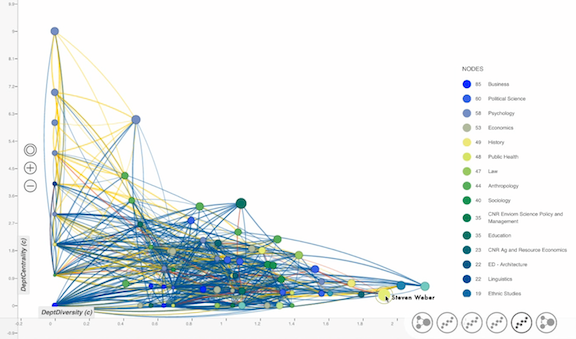
To create the network graph, Sedenberg collected an array of data related to academic connections, including records of dissertations co-advised, grants co-awarded, courses co-taught, and articles co-published by members of Berkeley’s faculty. She then cleaned this data—for example, to ensure that faculty names are the same in different data sets— and conducted an initial analysis. She then shared this data set with Mappr, a San Francisco-based firm that specializes in data visualization, to create the final product: a dynamic, searchable tool that will appear as a morphing web of nodes, each representing an individual, group, or institution, all connected through their various collaborations. Features of the graph—such as color and the thickness of the lines—are based on variables such as academic field or the number of connections between groups. The project aims to showcase the different collaborations taking place within and between traditional disciplinary and institutional frameworks, and to show how these collaboration networks emerge and evolve over time.
Of course, Sedenberg notes that the graph is an approximation, rather than an exact depiction of collaborations taking place. “A historian who writes a book might be listed as the sole author and may not show a connection to other faculty members, even if s/he collaborates extensively with other faculty members to sponsor seminars or working groups,” she says. “Our selected metrics are limited, and there’s a big difference. This is a starting point to try to understand how these relationships are formed, where they occur, and what the network looks like.”
Matrix is sponsoring the Network Graph to build a stronger foundational understanding of the current collaborations taking place at Berkeley, which in turn will help foster new connections among students and faculty members from different domains. The Graph will be updated on an ongoing basis and will illuminate the impact of interdisciplinary research centers; it will be a valuable tool for faculty, students, and staff to navigate the Berkeley social sciences landscape and identify new potential collaborators and advisors.
At the same time, the Graph represents a cutting-edge approach to organizing and presenting data about large, complex organizations. It has potential to serve as a model for other visualizations of organizations that could be developed in the future by social scientists across the UC Berkeley campus.
“Other campuses can claim that they are interdisciplinary, but this lets us prove it,” Sedenberg explains. “The way universities function and how research is conducted is changing. Berkeley is all about openness and transparency, so this is the perfect place to explore what that means in a research context. We’re starting with the social sciences, but it would be great if we could expand this project to other disciplines in the future.”
Stay tuned to the Matrix website for updates on the Berkeley Research Network Graph in the coming months!