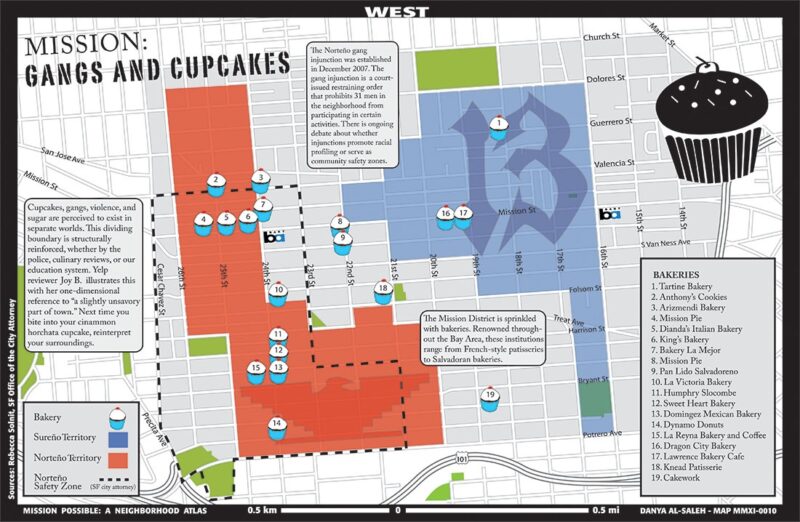
Darin Jensen’s office is lined with representations of San Francisco’s Mission District. One shows where different sounds originate on a Saturday night. Others show locations of old, leaky gas tanks. Another delineates the overlapping worlds of gang violence and that ultimate signal of gentrification, the cupcake shop.
“A collection of maps can show so many facets of place that an interpretation can emerge,” says Jensen, the in-house cartographer in Berkeley’s Department of Geography, who developed the maps with students as part of a project called Mission: Possible. “The Mission is not just one thing or another—gangs or hipsters, high-tech employees or second generation immigrants—it’s all these things.”
Jensen’s teaching of cartography emphasizes how the graphic design of maps can communicate and enhance our understanding of our environment from multiple perspectives. Using a syntax based in color, shape, informative text, and data, the maps illuminate themes ranging from environmental protection and social justice to where to find the most expensive cup of coffee. “Maps don’t have a first word,” Jensen says, “so you can step into the narrative anywhere.”
The narratives Jensen tells with maps are as diverse as his research methods. A 2012 project entitled Food: An Atlas was conceived as a crowd-sourced exercise in mapping the spaces our food inhabits, from production to consumption. After Jensen sent out a call for maps to universities, food policy networks, and professionals across the United States, more than eighty maps came rolling in, from academics and people who were “just interested in the spatial distribution of things,” Jensen says. The maps detailed food-related subjects such as the pathways of migrating tuna, the origins of the ingredients in beer, the geography of agricultural subsidies, and even Oakland’s taco trucks.
Collaborating with an interdisciplinary team from around the country—including a professor of geographic information system (GIS), a journalist, and a professor of education—Jensen edited the entries down to seventy maps, and provided some graphic design guidance. But it was important, Jensen says “to hold up the cartographer’s aesthetic. Each page is a whole new visual system.”
What emerged from this exercise in crowd-sourced, interdisciplinary scholarship is a visually arresting tour of how what we eat interacts with space. The maps range from a global scale—for example, a chart of where chili peppers are grown, or an unofficial map of national dishes of different countries—to the regional, such as a map of bird-friendly coffee plantations in Central America. From there, the perspective goes even more local, with one map detailing potential rooftop gardens in New York City. Some are historical, some are clearly oriented toward policy, and some have a touch of whimsy: one is entitled “Fungus AmongUS: Mushroom Farms in the U.S.A.”
Jensen and his team call their approach “guerrilla cartography,” in part because they involve people from diverse backgrounds in a way that is “cooperative and collaborative.”
To publish the collection, Jensen and his team ran a Kickstarter campaign that raised $30,000 in three weeks, enough to print the curated maps into a sleek published book. The process from the original call for maps to the final book publication took only six months, and today, the volume is being used in college classrooms across the country. He still receives orders, two years after the first print run. “Maps become historical artifacts the moment they’re printed,” Jensen says.
More recently, Jensen has been working with his cartography students to create a map of Oakland. The project, called “Intra-International Boulevard,” traces the iconic East-Bay street through the various dimensions of its demographics, history, culture, economics, built environment, and any other perspective that can be represented graphically “to create a holistic portrait of place,” as Jensen puts it.
“One powerful thing we are learning is that neighborhoods are defined by people, not a city’s neighborhood map,” Jensen says. “Based on work we’re doing documenting the language of business signage, it is clear that ‘Hispanic Oakland’ is not confined to what the Oakland calls the Fruitvale. We are seeing that Oakland truly is as diverse as those of us that live there believe, even if we’ve never had a matrix to know how or why. A map of all the places of religious worship along the International Boulevard corridor reveals no fewer than eighteen discrete denominations or religions.”
At the same time, the group behind Guerrilla Cartography is planning to compile a crowd-sourced compendium of maps focused on water around the world. Jensen admits that this is a huge and timely topic, but he seems undaunted; he aspires to get maps from more international contributors. As the project takes shape, Jensen continues to teach, and he works with professors across Berkeley’s campus to create original cartography for their work. “Geography is the ultimate interdisciplinary discipline,” he says, “from the human side—looking at development—or from the physical side, looking at climate change.”
Tips for New Cartographers from Darin Jensen (as told to Ryan Whitacre)
-
It is rare for a cartographer to be able to visit the place they map. But if they can, they will gain, through the experience, insights on space and place that can inform the map product. The colors, sounds, and smells—the energy of the place—will create an empathetic cartographer.
-
Go to the place and just be in it without trying to find data or even seek a sense of it. Go there and drink coffee or beer or browse the bookstores. Just be in the place first.
-
After the initial experience, go back and collect data. If time affords, go back again and again for data and fresh insights.
-
Avoid becoming part of the place. Cartographers should try to remain impartial and unbiased. Experiential cartography is a form of reportage.